29 August 2016
All photos are © Angus Hogg, 2016

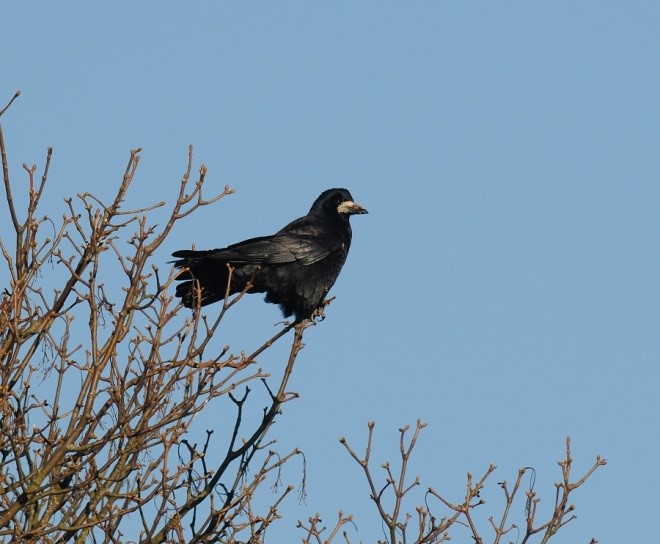
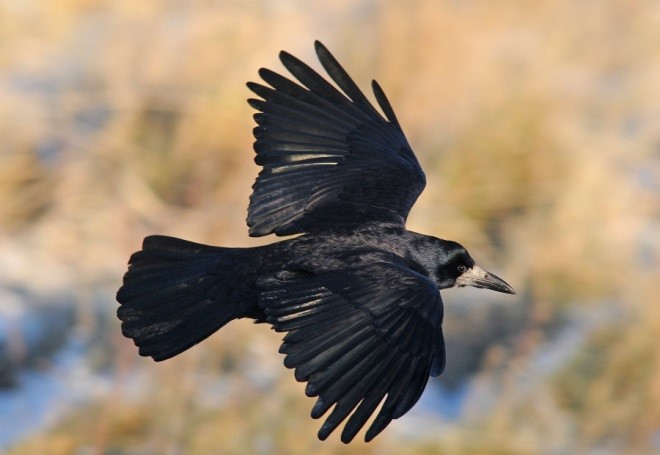
Some years ago – well, a considerable numbers of years ago – I decided to take part in a county-wide survey of Rooks which had been organised by the late Malcolm Castle. This wasn’t the first such survey which he’d organised, and it wasn’t going to be his last, but it seemed so delightfully simple that I chose one or two rookeries which I would then go out and try to count.
It certainly sounded simple and, typical of its organiser, the instructions were really straightforward. But, then, that’s the way surveys always look until you start on them! One major obstacle with my first large rookery at Kirkmichael was that many of the birds nested in the crowns of Scots Pine trees, rendering a totally accurate count almost impossible. However, a challenge like this was something to be tackled head-on, and, 4 hours later, I’d ploughed through just over 400 nests. One or two rookeries later, and I was starting to enjoy it, but it wasn’t until Malcolm had pulled all the results together that I saw the real purpose in doing such a series of counts.
That was 1975, and Rooks were doing well within Ayrshire. The survey was repeated in 1986, and it looked like the future was bright for the species. Moreover, the survey had provided all sorts of information for observers to get their teeth into e.g. rookery sizes, favoured nest-trees and overall distribution within Ayrshire. A further survey was arranged for 1996. Sadly, Malcolm didn’t live to see the final results written up, but Roger Hissett placed the results in the Ayrshire Bird report of 1997. These showed that the Rook was still faring reasonably well, despite substantial changes in the rural landscape.
In 2005 Kevin Waite took another slant on assessing the health of the Rook population in Ayrshire. His one-man survey drew on previous survey results, and looked at particular aspects such as urban growth, nest-tree species and site faithfulness. One urban area which seemed to have remained fairly stable was Maybole, perhaps due to the slow rate of urban expansion, and a mixed farming regime in the nearby countryside which appears to have shown relatively little change in the past 20 years.

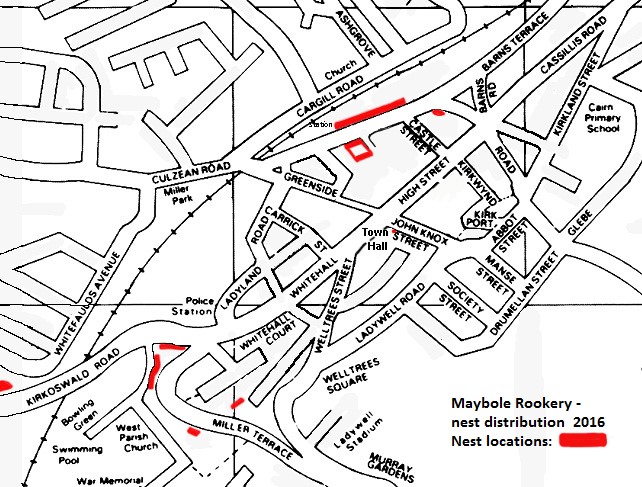
Within the town itself, most of the nests have been built in Beech trees, but one or two outlying locations, which hold between 1-5 nests, can reveal the use of other tree species, the strangest perhaps being in a car park near the Town Hall where the nests in Birch trees could easily be mistaken for the Witches’ Broom infestation. The table below outlines the count results between 2001 and 2016, most counts usually having been carried out in mid-April, at a time when most nests would clearly show signs of occupation.

The 2001 count was almost certainly an under-count since, at the time, I was not aware of the full extent of the area covered by all the nests. However, since 2005, there has been an increase, and a period of stability, followed by a very slight decline. It’s difficult to be certain that this decline is something to be concerned about – many Rookeries in nearby rural areas have flourished, fragmented, declined and, in some cases, disappeared during the past 15-20 years. The reasons for these fluctuations aren’t entirely clear (there’s a job here for some keen young field-worker!), but they will almost certainly reflect the relative abundance of food locally, to some extent. Other factors may include, for example, the increasing trend for Ravens to nest at the periphery of some Rookeries since, by nesting earlier than Rooks, they can exploit the availability of a nearby food supply.
There appears to be little problem with human interference in Maybole at present, so food availability perhaps linked to a changing climate pattern could emerge as important issues. Either way, Maybole’s Rooks continue to fare reasonably well within their urban environment. This kind of survey is easily carried out, and will not just provide a picture of what’s happening to a species over a period of time, but will also throw up a range of questions associated with these results e.g What are the main factors driving the population changes? This, then, can become the basis for a related survey which can use the nesting figures as a starting point. Is anyone up for it?
